



Project Health Command Center
**Is Your Project Really on Track?**
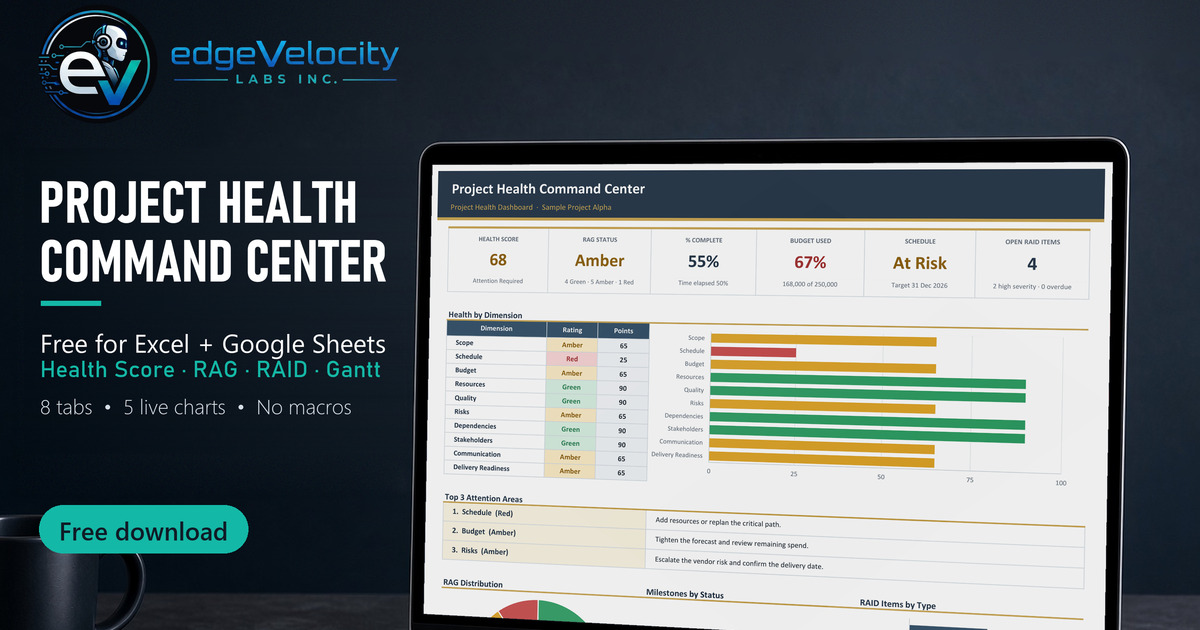
Most project trackers just list tasks and dates. The Project Health Command Center tells you the truth: an automatic, weighted health score across 10 dimensions of your project — so you know exactly where things stand before your stakeholders ask.
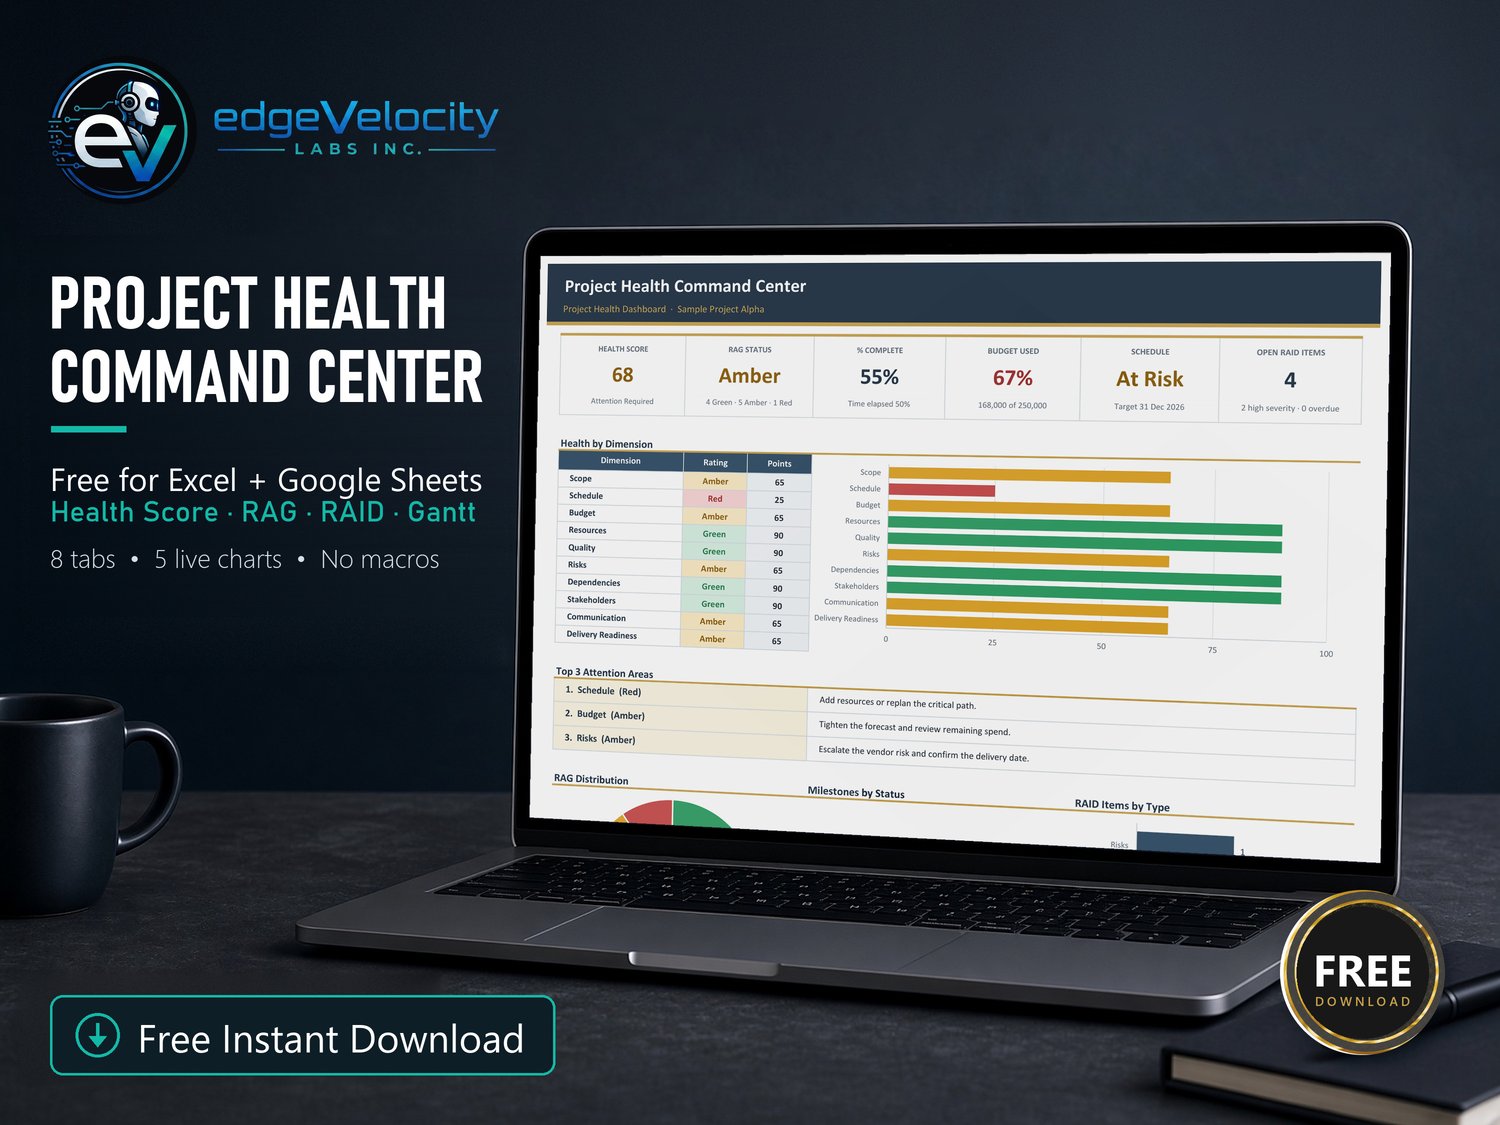
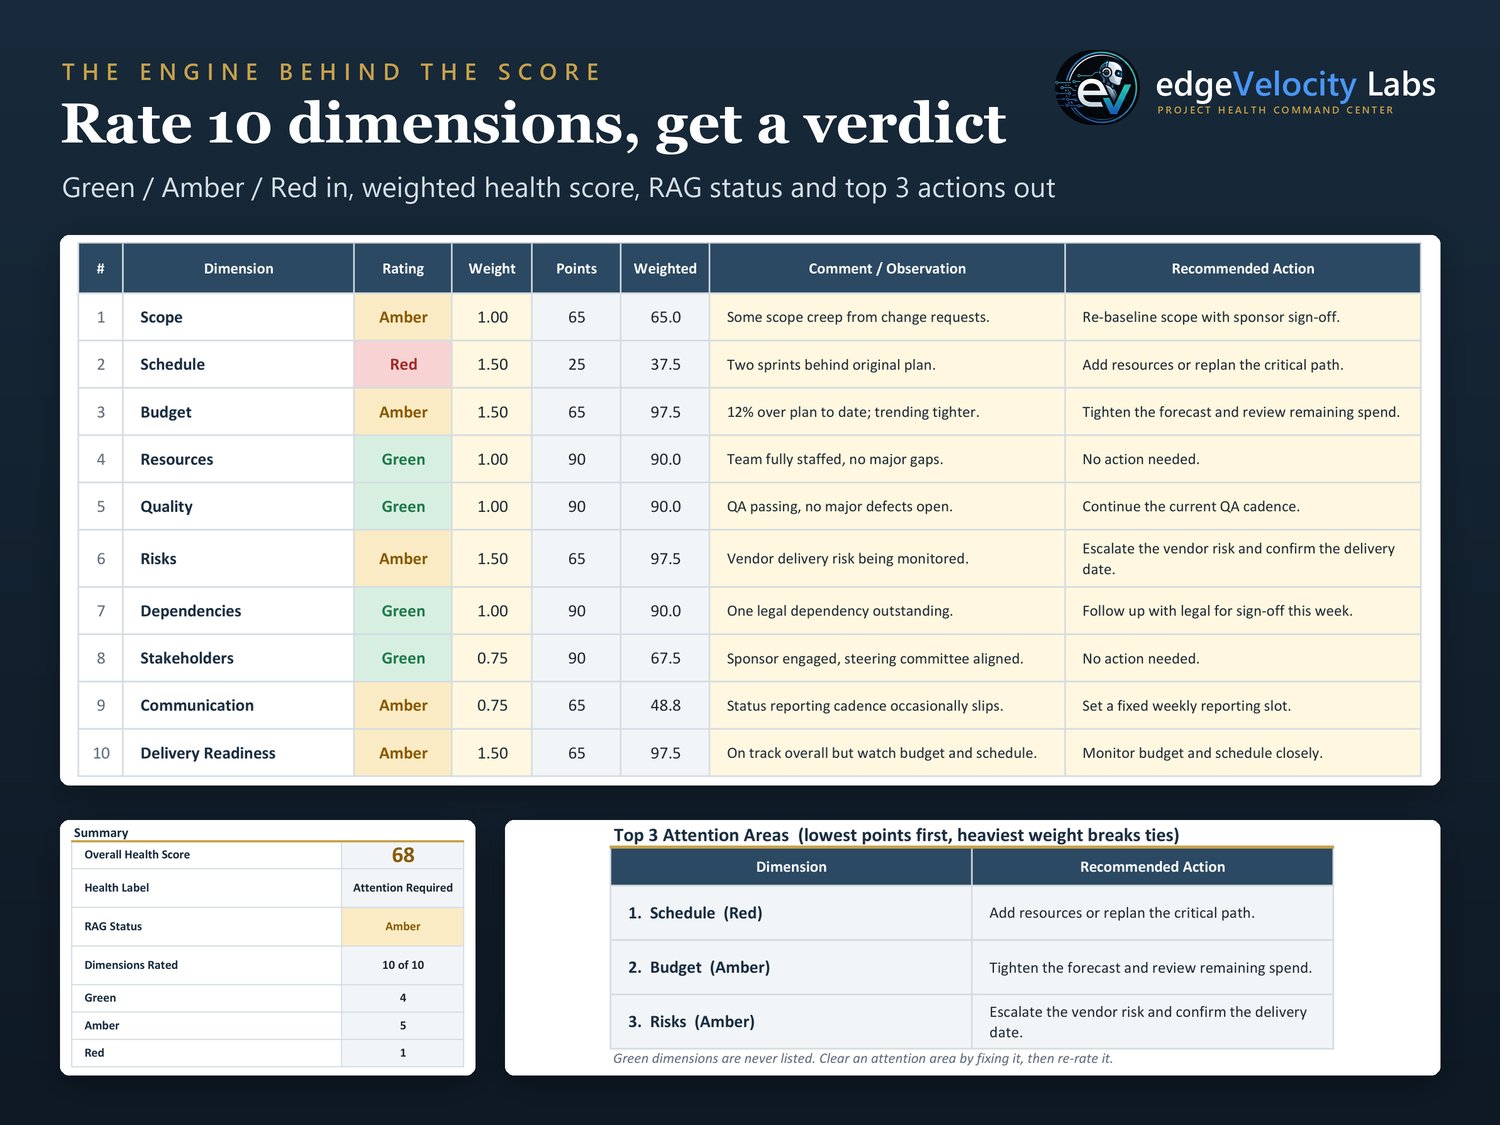
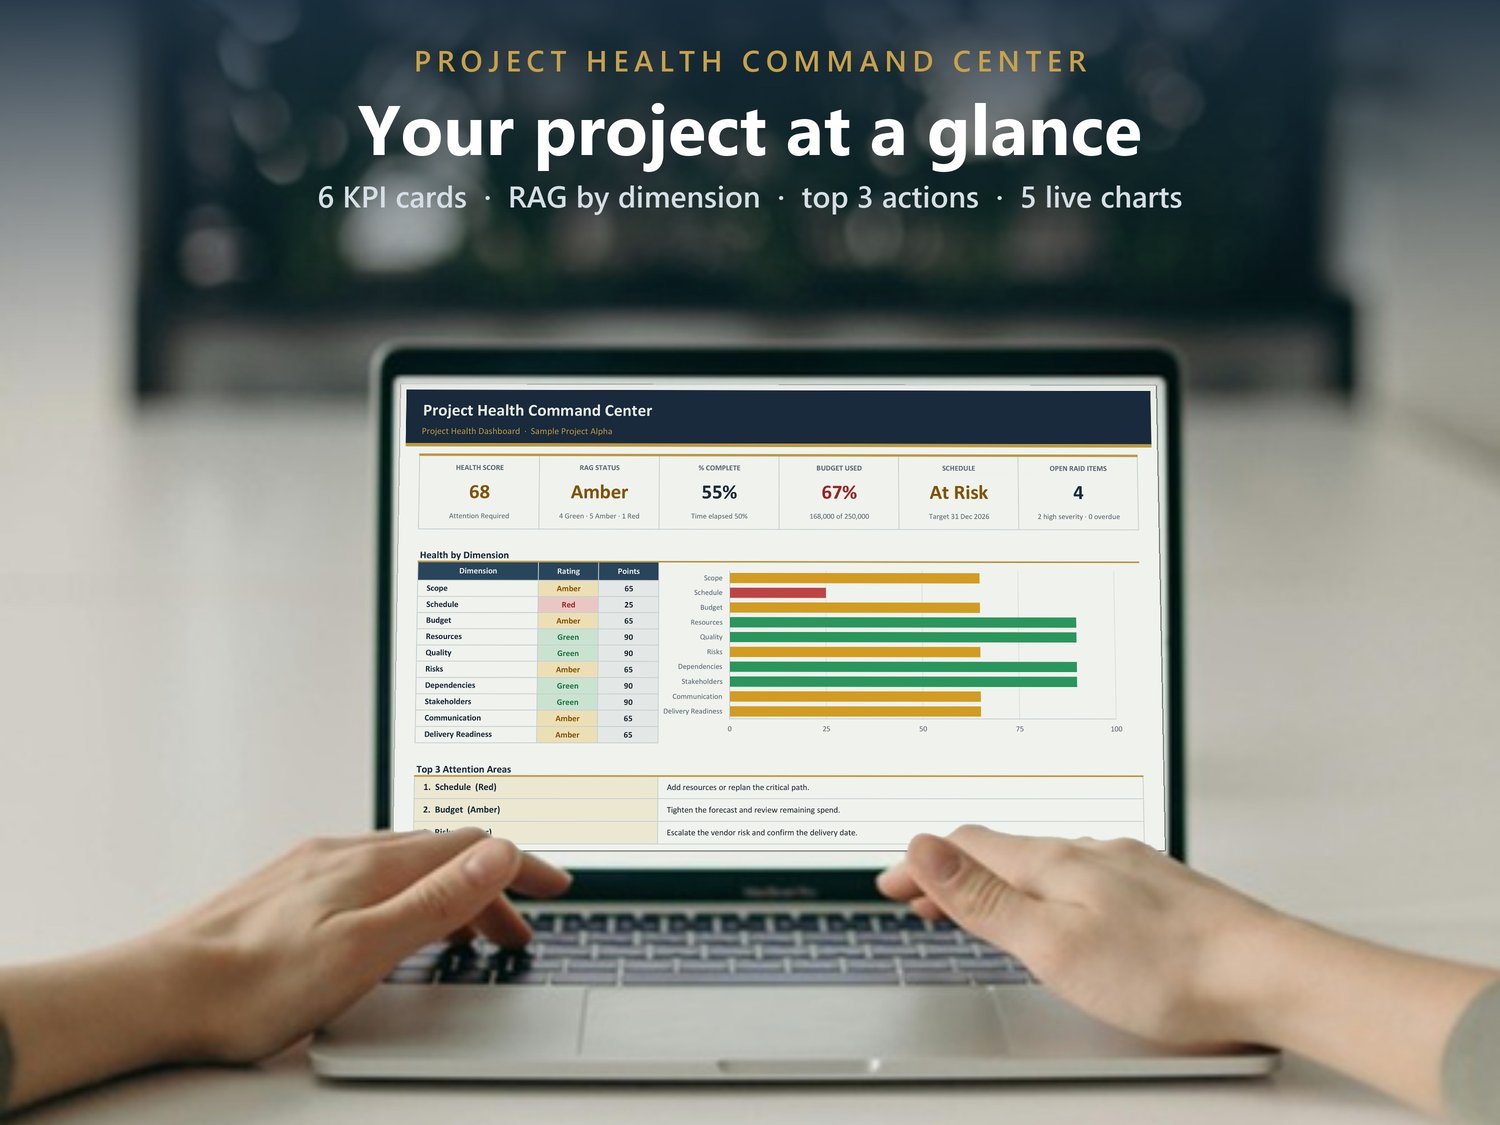
Rate each dimension Green, Amber, or Red, and the workbook does the rest — calculating your Overall Health Score (0–100), your RAG status, and your Top 3 Attention Areas automatically. Everything rolls up into a live executive dashboard with 5 charts, updating instantly as you fill in the other tabs.
Built for project managers, small business owners, and anyone running a project who wants real visibility without the cost or learning curve of enterprise PM software.
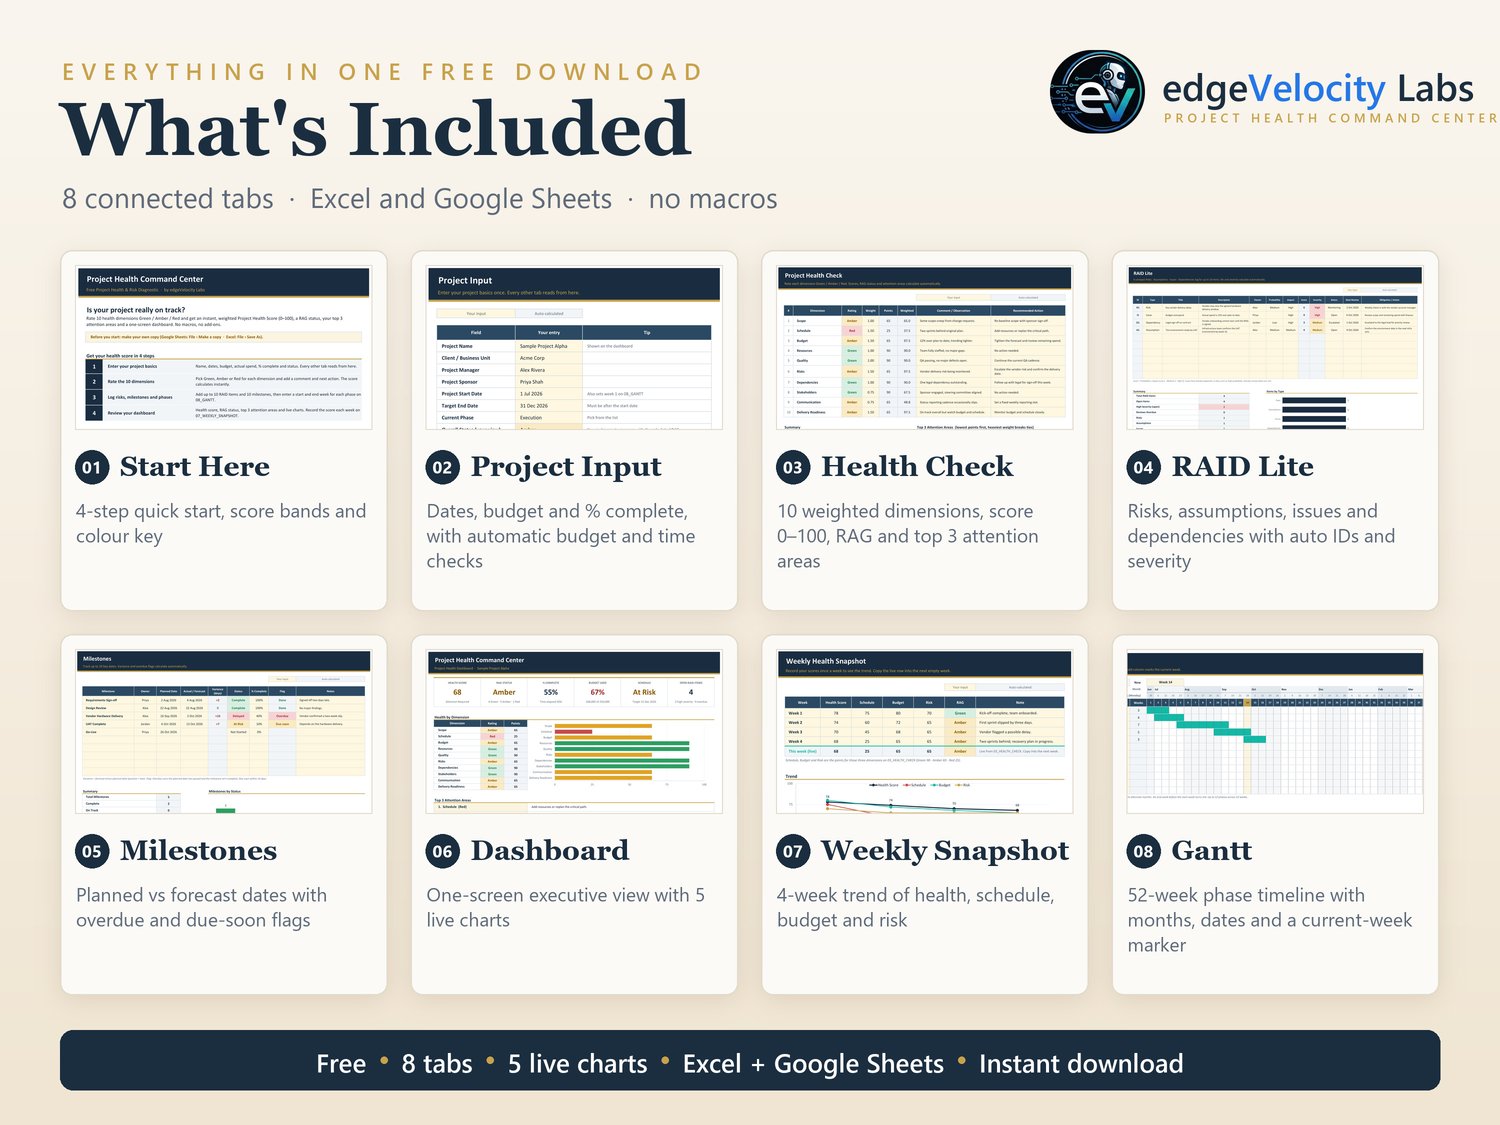
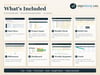
**What's inside (8 tabs):**
- **01 Start Here** — a 4-step quick-start guide plus the scoring-band legend, so you're productive in your first minute.
- **02 Project Input** — the basics (project name, dates, budget, % complete, status) that feed every other tab automatically, plus quick checks for budget used, time elapsed and progress vs time.
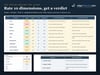
- **03 Health Check** — rate 10 weighted dimensions (Scope, Schedule, Budget, Resources, Quality, Risks, Dependencies, Stakeholders, Communication, Delivery Readiness) Green / Amber / Red. Your Overall Health Score, RAG status, and Top 3 Attention Areas calculate automatically — this is the engine behind the whole workbook.
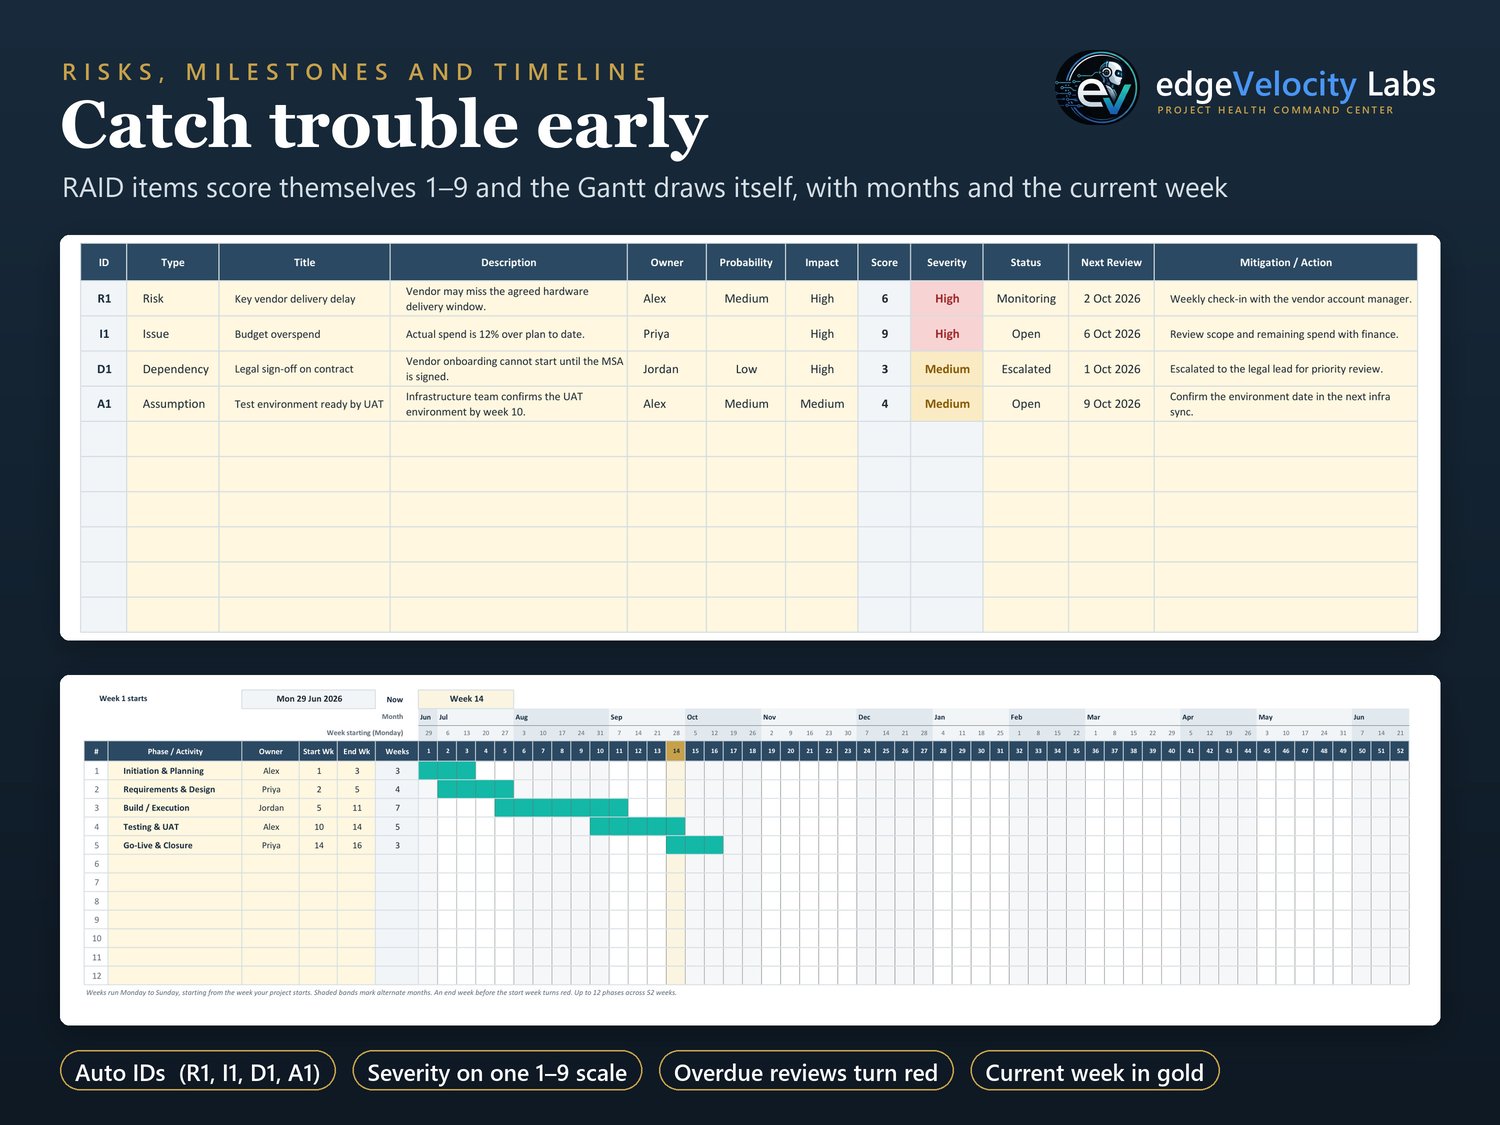
- **04 RAID Log** — track Risks, Assumptions, Issues, and Dependencies with automatic IDs, a severity score on one 1–9 scale, overdue-review flags and a breakdown chart.
- **05 Milestones** — plan key delivery dates and track status (On Track / At Risk / Delayed / Complete), with forecast variance, automatic overdue flags and roll-up counts.
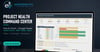
- **06 Dashboard** — your one-screen executive view: overall score, RAG status, budget utilization, 5 live charts, and your Top 3 Attention Areas.
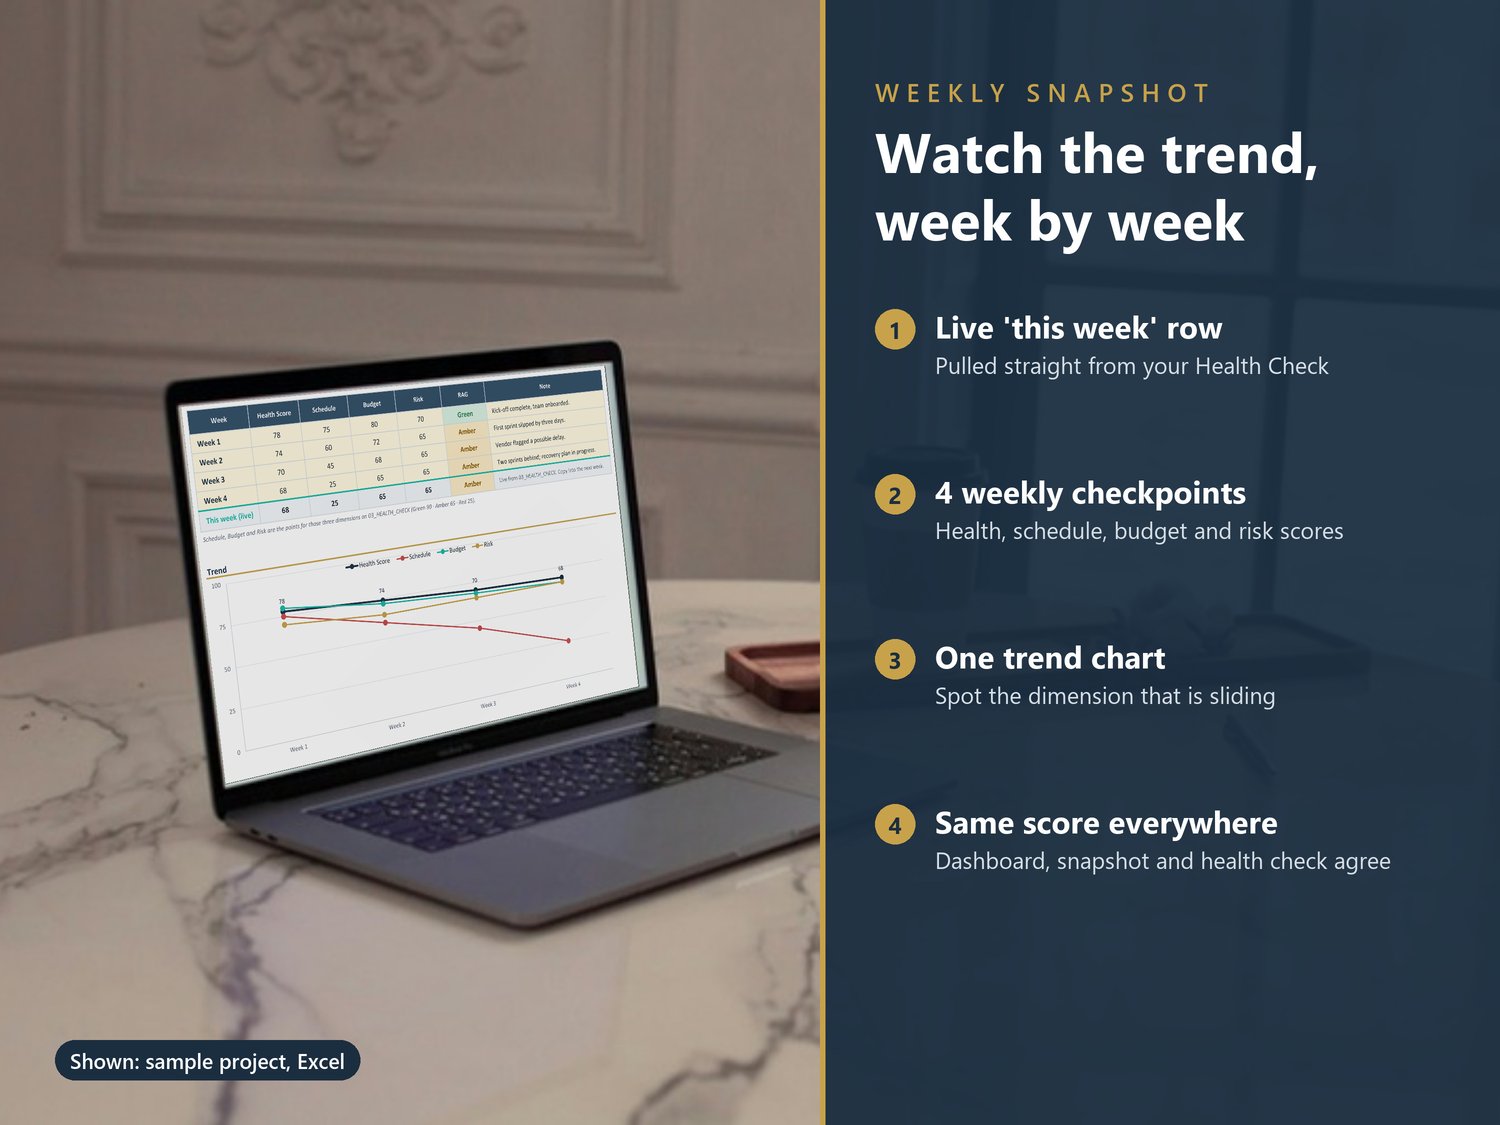
- **07 Weekly Snapshot** — log up to 4 weekly checkpoints and watch your health trend move over time, with a live "this week" row to copy from.
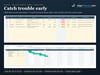
- **08 Gantt** — a high-level, auto-populating Gantt chart spanning a full year — enter a Start Week and End Week per phase and the timeline bar draws itself, with the current week highlighted.
**Works everywhere.** Every formula, chart, and conditional format is built to render identically in Microsoft Excel and Google Sheets — no macros, no add-ons, no Apps Script.
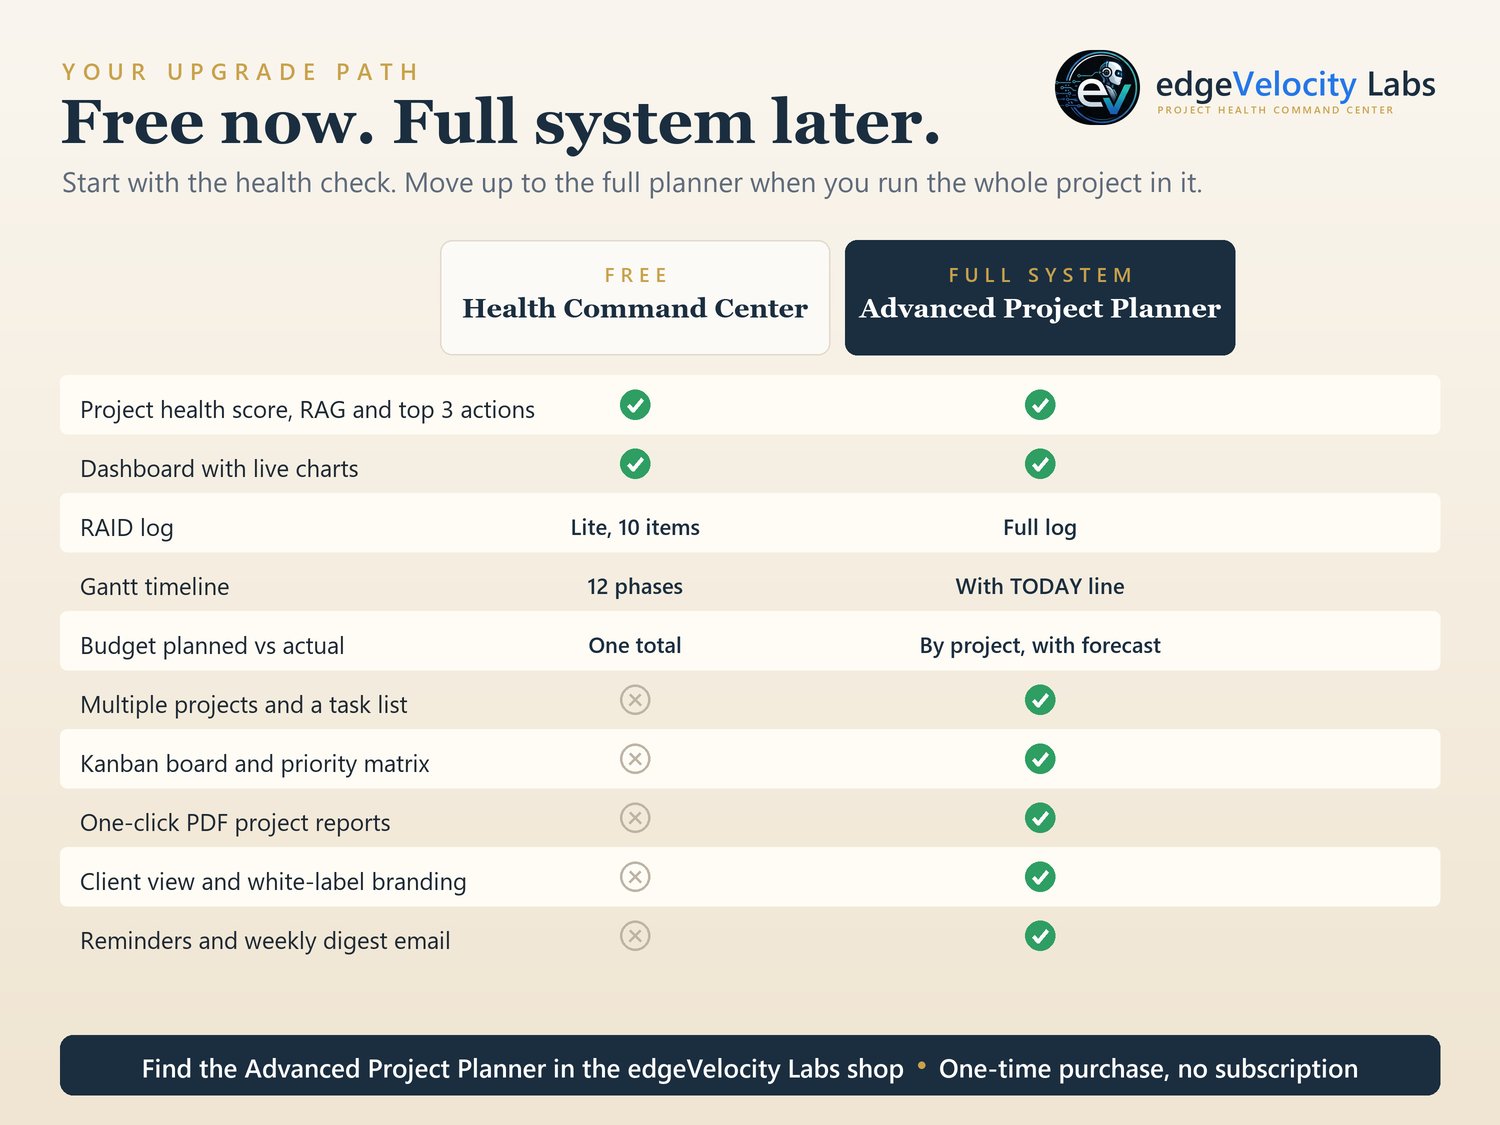
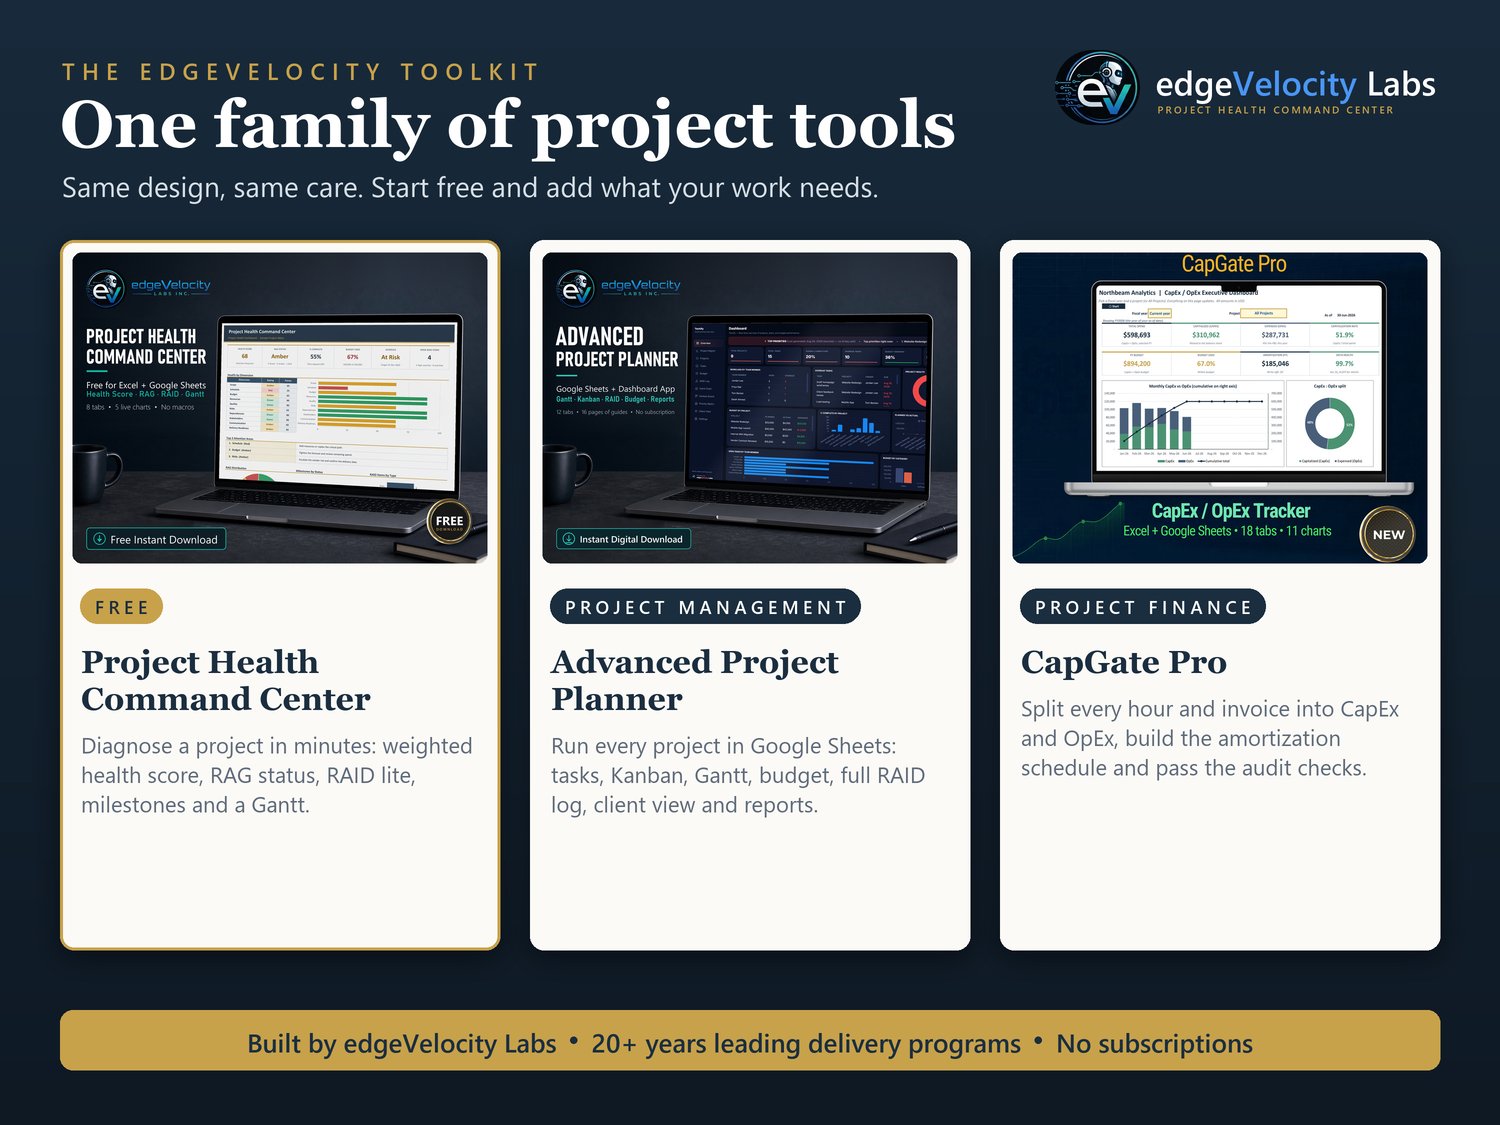
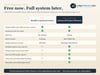
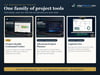
**Want the complete system?** The Advanced Project Planner brings full planning, Kanban, Gantt, budget tracking, RAID management and reporting together in one workspace.
→ https://edgevelocity.net/digital-products/advanced-project-planner/
Managing capital and operating spend? CapGate Pro tracks CapEx and OpEx with approval gates.
→ https://edgevelocity.net/digital-products/capgate-pro/